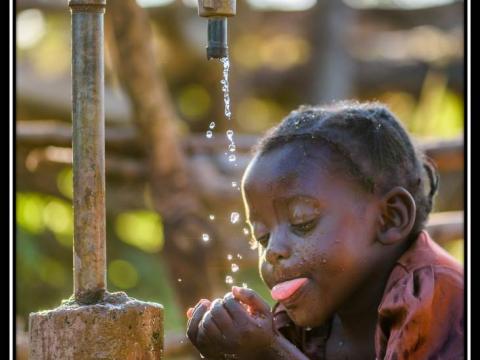
World Vision WASH Evaluation, 2015.
Download
This report describes the World Vision WASH Evaluation (WVWE) undertaken to:
- describe the current status of World Vision’s WASH Programs in 10 countries in Sub‐Saharan Africa in a consistent comparable way
- provide a baseline against which future progress and achievement may be rigorously measured in World Vision (WV) program areas and contrasted with comparison areas, and
- identify possible opportunities for WV programming improvement.
The report presents methods and results from the WVWE across ten countries in Sub‐Saharan Africa. The ten countries of study included Ethiopia, Ghana, Kenya, Malawi, Mali, Mozambique, Niger, Rwanda, Uganda, and Zambia.
Across the ten countries, the WVWE was conducted in 26,851 households, 1,193 water points, 2,568 schools, 1,453 health facilities, and included 7,561 microbiological water quality samples, 615 arsenic tests, and 825 fluoride tests. A multi‐stage geographically clustered population‐based sample design was utilized in household and water point selection, and a simple random sample was utilized in health facility and school selection to ensure consistent, generalizable data collection over a large area.
For Zambia the report highlighted:
- On average, 62 percent of WV households have access to a year‐round improved drinking water source,
- 26 percent have access to improved sanitation, and 34 percent always have water and soap present for hygiene purposes.
- On average, 62 percent of WV households have microbiological water quality of low to intermediate‐risk and 33 percent have access to improved water that is within 30 minutes collection time.
- On water service sustainability, on average, only 34 percent of households report they regularly pay for their water service and 56 percent report a water committee.
- On safe storage, 82% of households cover their stored water, but only 19% of households were observed safely removing water from storage.
- While 67 percent of households have access to some type of sanitation, which incorporates Community‐led Total Sanitation activities, only 26 percent of households have access to improved sanitation.
- The lack of a slab on the pit of many household latrines is the reason for the low rates of improved sanitation access.